Chapter 2 Basic Usage
The package consists of a single function: superheat.
The superheat function takes data objects, the most important of which are:
- X: the heatmap matrix,
(optional)
yr: a vector of values to be plotted to the right of the heatmap,(optional)
yt: a vector of values to be plotted above the heatmap.
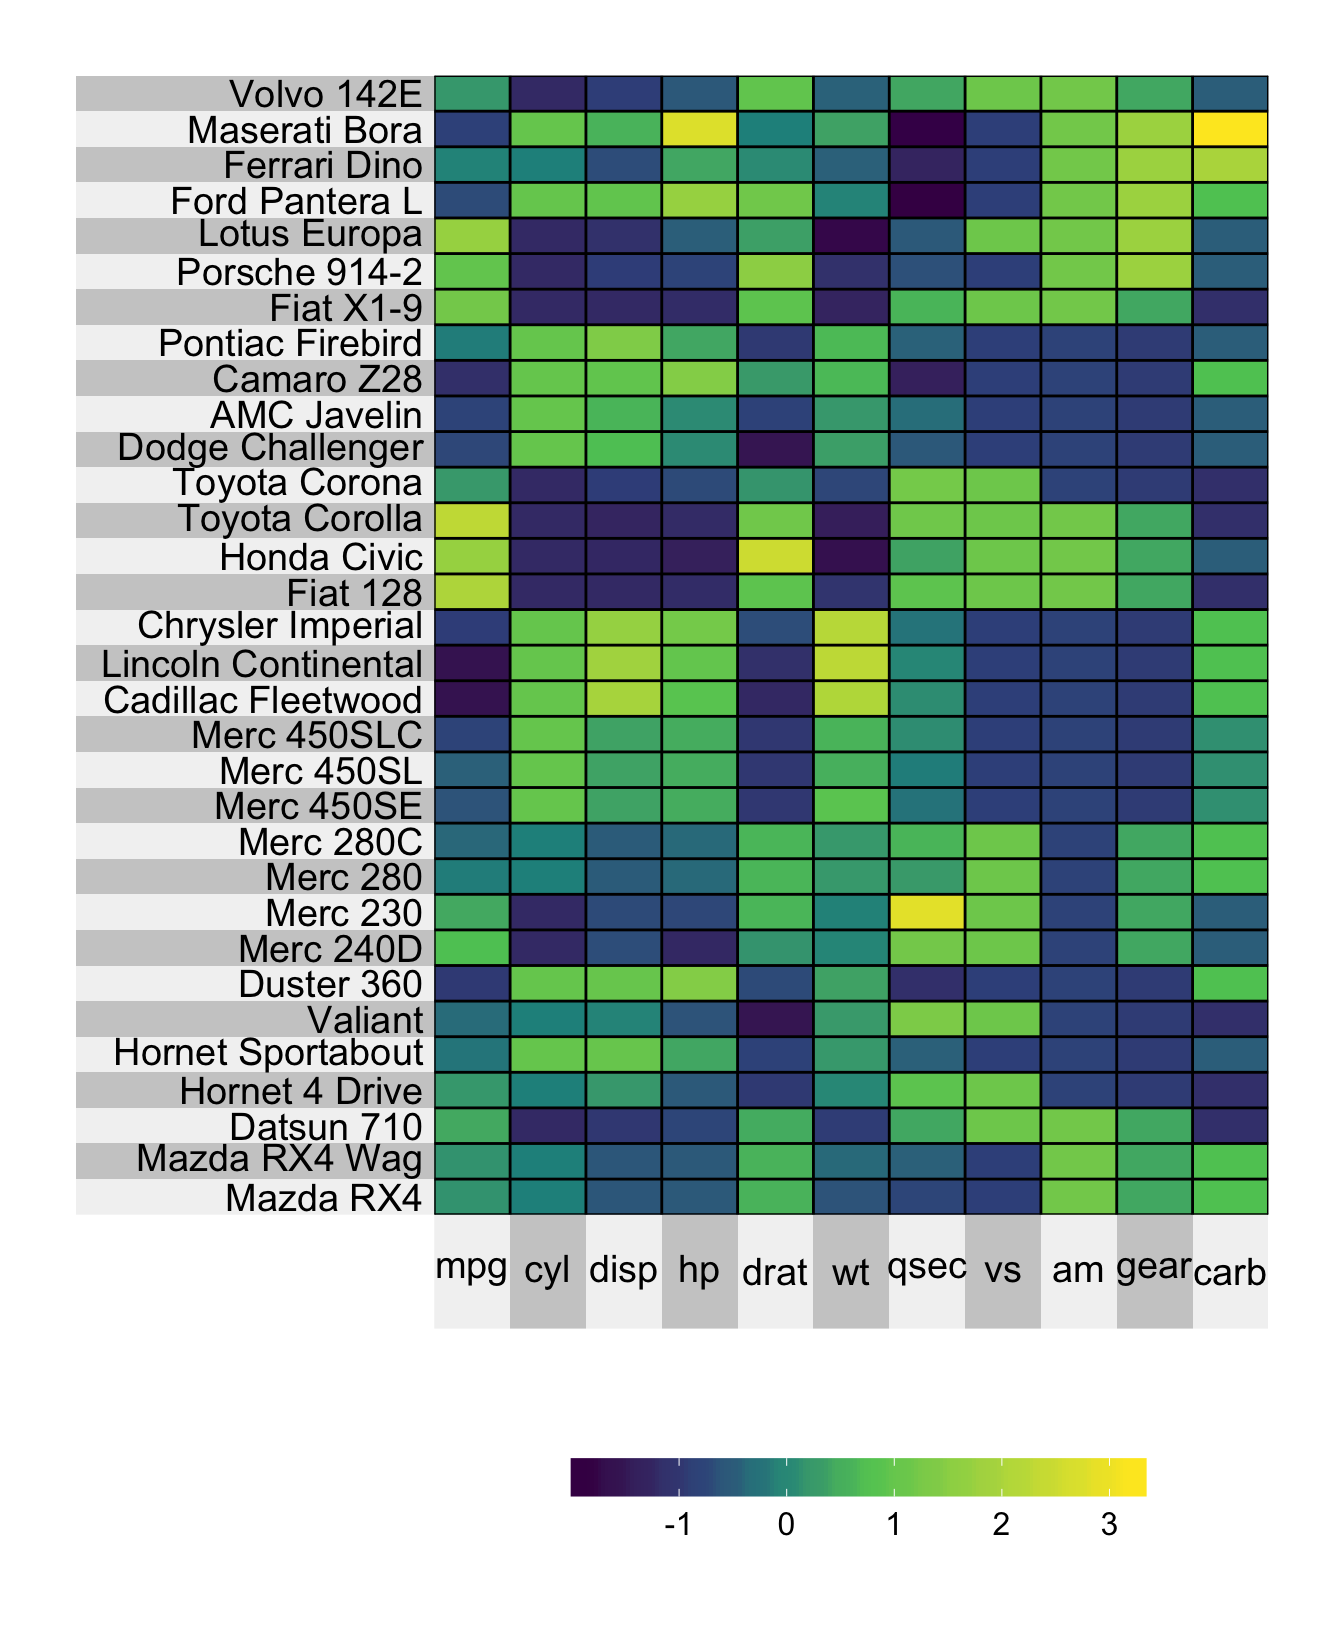
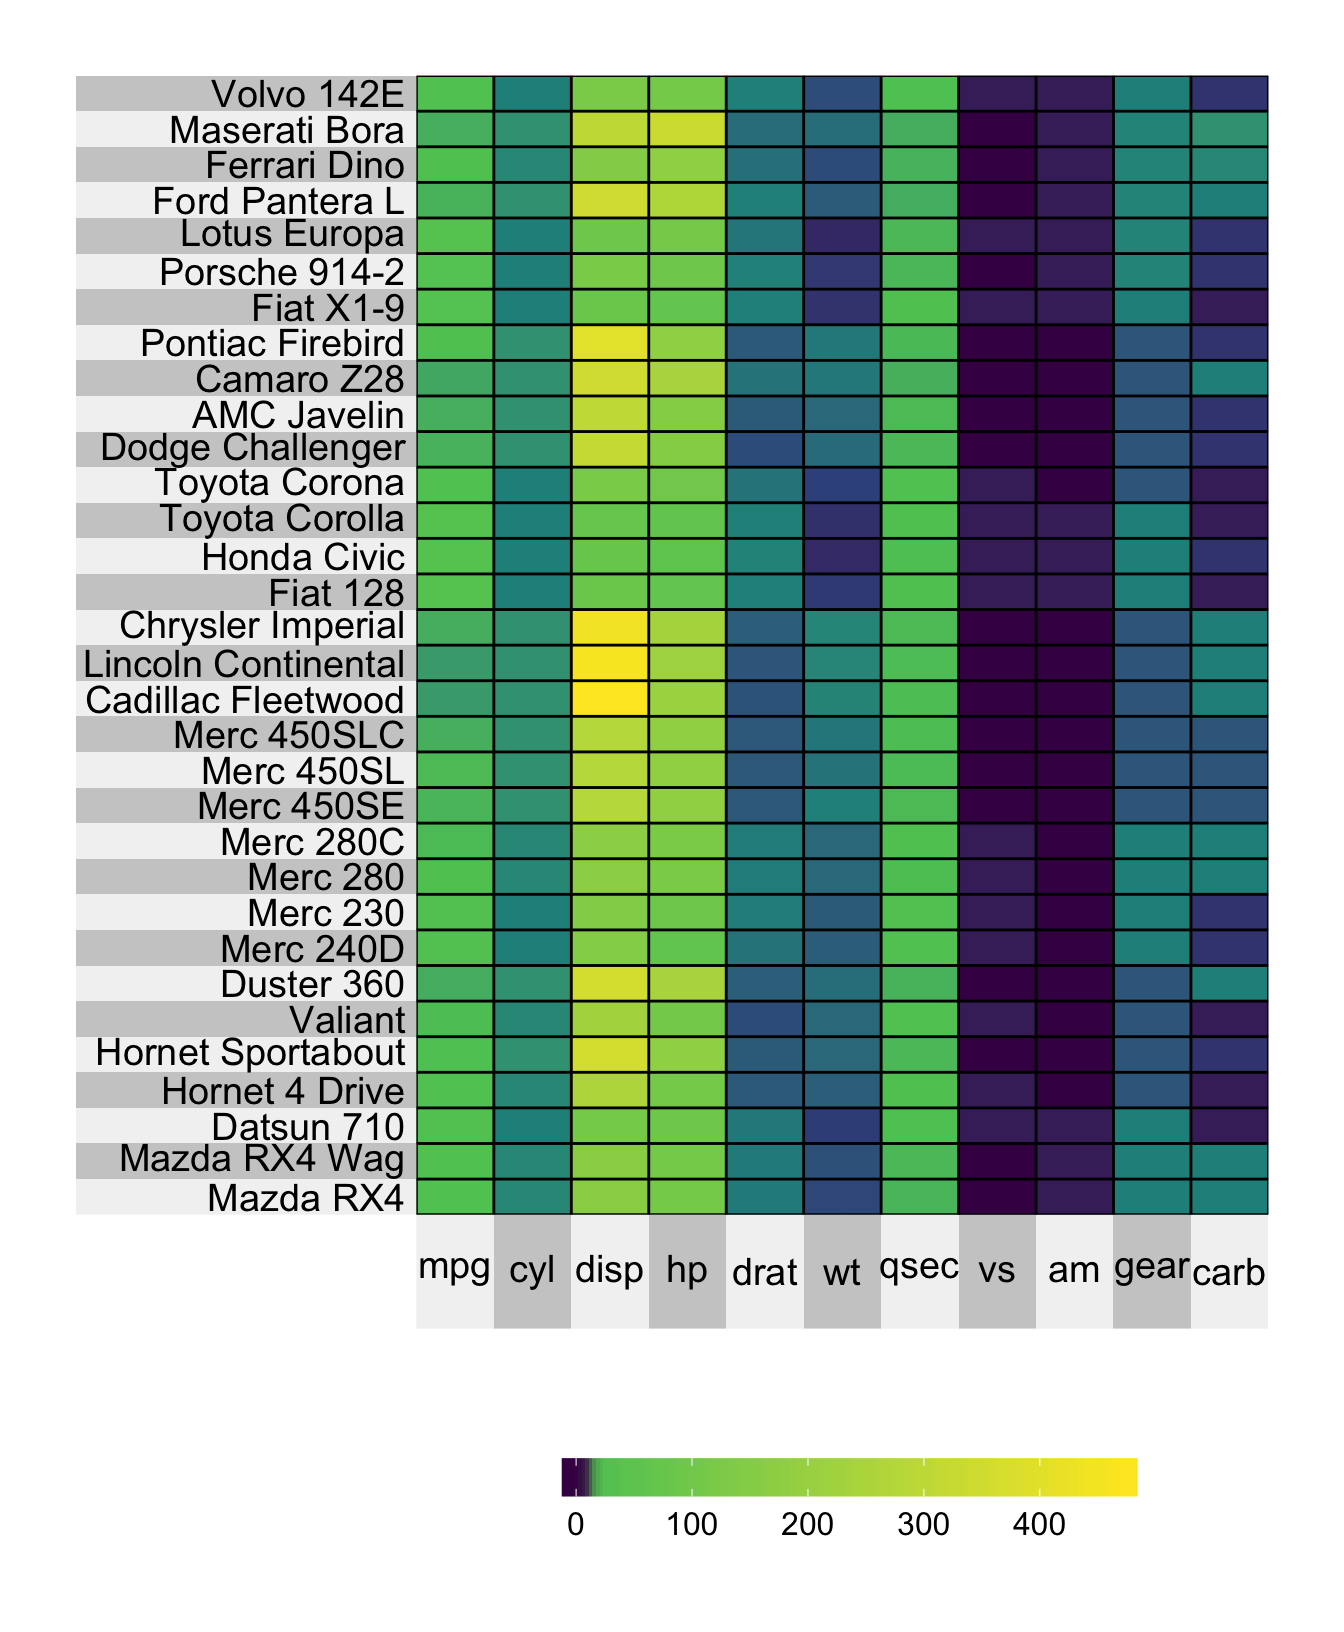
As our running example, we will use superheat to visualize the mtcars dataset. For more complex examples, please see our accompanying website: https://rlbarter.github.io/superheat-examples/
A simple visualization without any additional arguments is presented below.
2.1 Heatmap scale
Notice that the variables in the mtcars dataset presented above each have very different scales, making comparisons between cars difficult. Fortunately, it is easy to scale the columns of the matrix (to mean 0 and standard deviation 1) using the scale argument.
It is important to be aware that they way in which you scale your data can alter the interpretation of your heatmap. It is always a good idea to scale the input matrix yourself using the method that makes the most sense for your data, for example by converting your data to a [0,1] quantile-preserving scale, or simply by mean-centering.