Ongoing projects
Examining the organ waitlist allocation system
Our aim is to develop mathematical models of survival to evaluate the effects of various potential policy changes to the allocation system for livers and kidneys. The current allocation algorithm for livers is based primarily on age, geographical proximity, and the MELD score. The MELD score has been shown to be an accurate predictor of waiting list mortality, and thus one can see the liver allocation algorithm as one that successfully optimizes the objective function assigning organs to the sickest patients first, thus reducing waiting list mortality.
Recently, UNOS has developed a proposal which seeks to modify the OPTN/UNOS region boundaries in order to address the severe imbalance in MELD or PELD scores needed for transplantation across different regions. This proposal, however, does not affect the primary objective function (i.e. the allocation system will continue to prioritize the sickest patients first).
As of 2014, the current allocation system for kidneys is based on the EPTS score, calculated using on time on dialysis, diabetes status, transplant history and age. For any given candidate, the EPTS score represents the percentage of kidney candidates in the nation with a longer expected posttransplant survival time. This allocation procedure can thus be seen as optimizing the objective function that assigns organs to those who will have the longest posttransplant survival time.
The allocation systems for livers and kidneys use algorithms that prioritize different goals: the former prioritizes reducing waiting list mortality, while the latter, relative to the first, prioritizes posttransplant survival.
We will develop mathematical models to explore the potential effects of allocation policies that can address both of the current liver and kidney allocation systems.
Dynamically predicting acute rejection for HIV positive kidney transplant patients (UCSF collaboaration)
Since the advent of the HAART treatment regimen, HIV has progressed from a death sentence to a manageable condition. Today, millions of people are living with HIV as a chronic condition, allowing for HIV-associated conditions to develop. The most common such conditions include HIV-Associated Nephropathy (HIVAN) leading to kidney disease, and coinfection with Hepatitis C or Hepatitis B leading to liver disease.
As a result of the high incidence of kidney and liver disease among HIV-positive patients, there is an increased demand for kidney and liver transplants. Until very recently, however, HIV was considered a contraindication for transplantation primarily due to the perception that HIV patients have high mortality rates, as well as a lack of understanding concerning the effects of immunosuppressives on HIV as well as possible interactions between HAART antiretrovirals and immunosuppression.
Initial studies, however, have shown that patient and graft survival among HIV-positive kidney and liver transplant patients are comparable to their HIV-negative counterparts. However, rates of acute rejection have been shown to be significantly higher among the HIV-positive transplant patients. This is a particularly puzzling finding as HIV patients have significantly under-functioning immune systems. So how are they mounting such vigorous immune attacks on their transplanted organ?
Predictive Modeling of Surgical Site Infections Using Electronic Health Record Data (UC Davis collaboration)
We are developing machine learning models using Electronic Health Record (EHR) Data to predict patients who may develop Surgical Site Infection (SSI) post-operatively. SSI are one of the most important post-operative complications that increase mortality, morbidity, increased length of hospital stay, poor surgical outcomes and healthcare expenditure.
Superheat
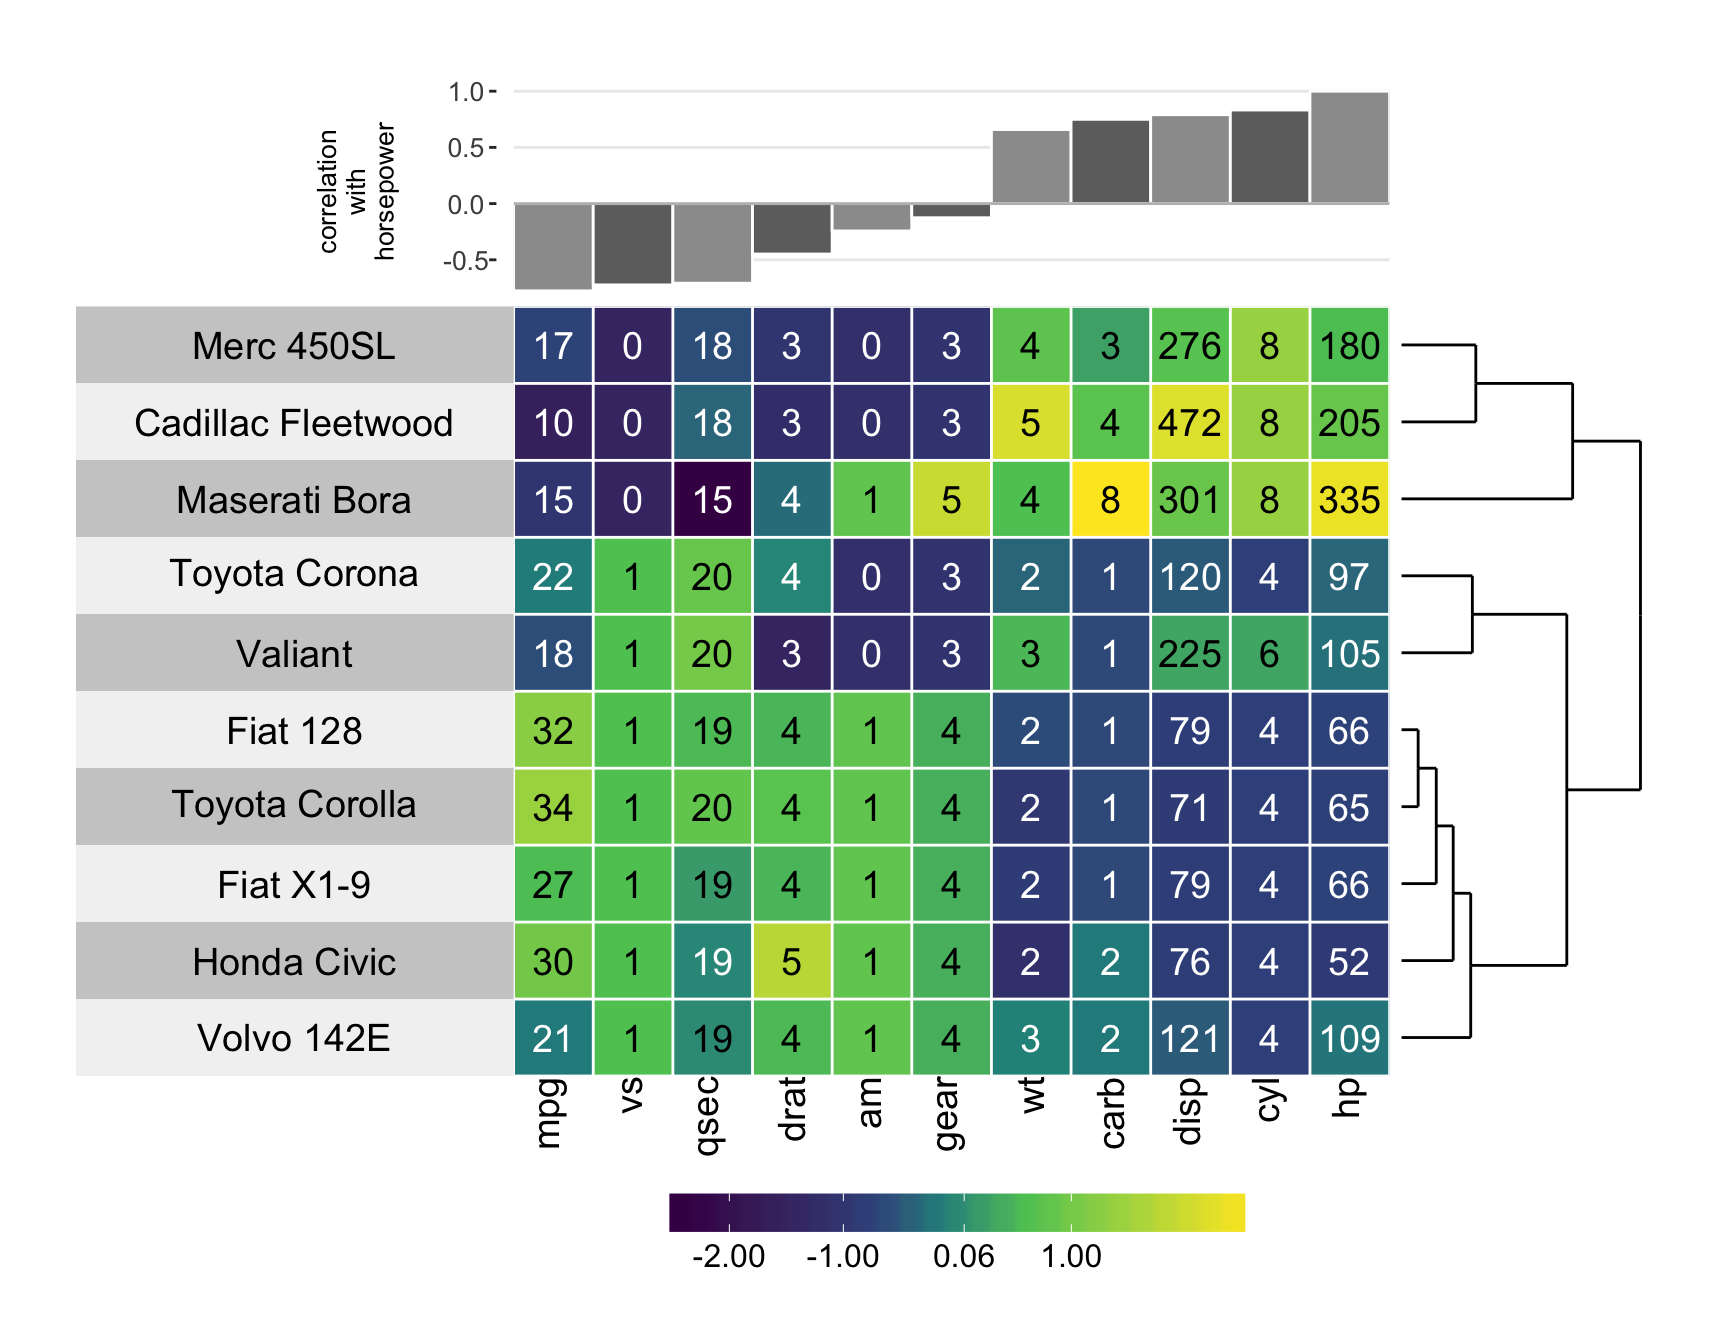
I made a super cool R package (github, vignette, paper) for creating customizable, extendable, and beautiful heatmaps.
The motivation of the superheat package was to allow the user to visualize a design matrix, X, while simultaneously examining a response variable, y. Ideally, this would allow the viewer to explore how the independent variables and response are related to one another. However, we quickly realized that the applications are far more general than simply visualizing a supervised heatmap (hence the name, “superheat”), and we extended the usage to allow for a huge range of extensions to the heatmap.
It is extremely easy to produce plots like the example below describing 10 randomly selected cars from the famous mtcars dataset. If you’re interested in producing this specific plot, see my blog post displaying the code.
Here is a video of me presenting superheat at the UseR! Conference 2016 at Stanford University.